
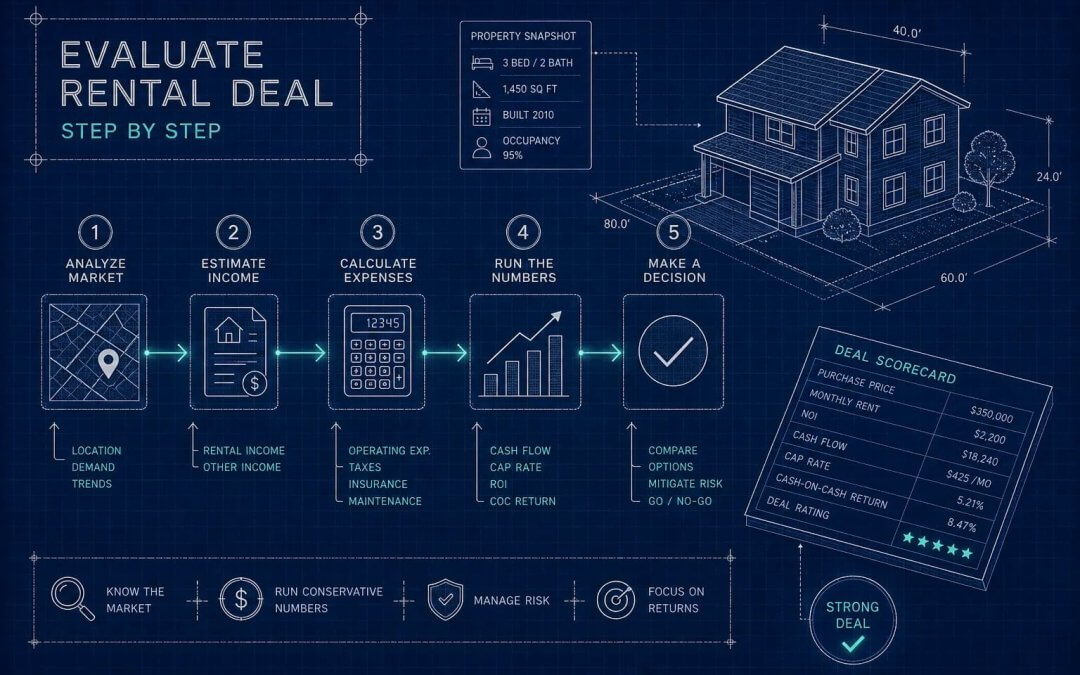
How to evaluate a rental property deal step by step: gather honest rent comps and local vacancy data, calculate net operating income and cap rate, model cash flow and cash-on-cash return after financing, factor in repair costs and CapEx reserves, then run the deal through a go/no-go checklist. That is the complete sequence. Every step in this article unpacks exactly how to do each one, with the formula, a worked number, and a plain explanation of what the result means for your decision.
A repeatable process that works whether you are buying in your own backyard or three states away.
Key takeaways
- Start with real inputs: Rent comps and vacancy data must be property-specific, not zip-code averages. Bad inputs make every downstream number useless.
- NOI is the foundation: Net operating income, calculated before debt service, is the number that makes cap rate and cash flow analysis possible.
- Cash-on-cash return measures your actual yield: Target 8% or higher in 2026 after financing, all-in cash invested, and a realistic expense stack.
- Repairs change the math materially: A moderate rehab on a 1,500 sq. ft.
- Use the 1% rule as a filter, not a decision: In 2026, treat 0.8%–1.0% rent-to-price as a prompt to run full underwriting, not as a buy signal.
- A go/no-go checklist removes emotion: If the deal does not clear each benchmark at today’s price, the numbers have already given you the answer.
What market data do you need before running any numbers?
The analysis only works if the inputs are real. Before touching a spreadsheet, you need two things: an honest rent estimate and a clear picture of local vacancy. Skipping this step and working backward from a price you want to justify is how investors end up holding deals that never cash flow.
Where to pull reliable rent comps
RentCast and PropMetrics are our recommended free starting points for property-level rent estimates in 2026, with Zillow and Redfin useful for cross-checking active asking rents. The key discipline is comparing like-for-like: same bedroom and bath count, similar square footage, similar condition and location within the submarket. Averaging every listing in a zip code will produce a number that fits nothing. Our local market specialists pull ground-level rent data in every market we operate in, which is a meaningful edge for out-of-state buyers who cannot walk a neighborhood or call a local property manager.
Reading vacancy rates for your target market
National single-family rental vacancy runs roughly 5–7%, with higher-supply Sun Belt markets in the Southeast and South Central sitting closer to 8–9%. Underestimating vacancy is one of the most common ways investors overstate cash flow projections. Use 5% as a conservative floor for stable Midwest markets and push that assumption to 7–8% in metros with heavy new construction coming online.
Step-by-step NOI and cap rate calculation
Net operating income is the foundation of every other metric in rental property underwriting. Get this wrong and every downstream number is useless.
Building your expense stack
The NOI formula is: NOI = Effective Gross Income (EGI) minus all operating expenses. EGI equals scheduled gross rent plus other income minus vacancy and credit loss. Operating expenses include property taxes, insurance, property management (typically 8–10% of collected rent), maintenance reserves, and owner-paid utilities. Mortgage principal and interest do not belong in this calculation; those come later.
For a professionally managed single-family rental, a 40–45% expense ratio is a reasonable starting benchmark. Replace that percentage with real line-item figures as soon as you have them.
Cap rate benchmarks and what they tell you
Cap rate equals NOI divided by purchase price, expressed as a percentage. According to Q2 2026 data from Colliers, single-family rentals are averaging around 5.0% nationally. Cap rate measures unlevered yield, meaning it tells you how the property performs before financing, which makes it useful for comparing deals on equal footing across markets. Supply-constrained markets run lower cap rates; high-construction markets run higher ones. What cap rates do not tell you: they ignore debt structure and your actual cash-on-cash return once financing is in the picture.
Two additional screening tools worth knowing: the gross rent multiplier (GRM), purchase price divided by annual gross rent, gives you a quick relative-value read across deals before you build a full model. A lower GRM signals better gross income relative to price. Rental yield, calculated as annual rent divided by purchase price, works similarly and is useful for a fast cross-market comparison when you are screening multiple markets at once.
Step-by-step cash-on-cash return calculation
This is where financing enters the picture. Cash-on-cash return is the number that tells you what your actual dollars are earning, and it is where most investors either confirm a deal or walk away from it.
Annual cash flow after debt service
Annual cash flow equals NOI minus annual debt service.
| Loan type | Typical rate (2026) | Typical down payment | Common term |
|---|---|---|---|
| Conventional investment mortgage | 6.25%–7.75% | 15%–25% | 15- or 30-year fixed |
| DSCR loan | 6.5%–8.0% | 20%–25% | 30-year fixed or ARM |
| Portfolio or bank loan | 7.5%–8.5% | 20%–35% | 15- or 30-year amortization |
| Hard-money / fix-and-flip | 10%–13%+ | 25%–40% | 6–18 months, interest-only |
Total cash invested and the cash-on-cash formula
Cash-on-cash return equals annual pre-tax cash flow divided by total cash invested, multiplied by 100. The denominator is not just your down payment. It includes closing costs, initial repairs, and upfront reserves. In 2026, most experienced investors we work with use 8% as a minimum screen, with 8–12% representing a solid buy-and-hold target. A 6–8% return can still work for a low-maintenance property in a high-growth market, but it leaves little margin for error.
How do repairs and vacancy gaps affect your deal numbers?
Two items kill more rental deals than anything else: underestimated rehab costs and an overly optimistic vacancy assumption. Both come directly out of cash flow.
Estimating upfront rehab costs realistically
For a 1,500 sq. ft. Add a 10–20% contingency on top of any scope estimate, especially for properties built before 1990. That rehab budget goes directly into your total cash invested number and reduces your cash-on-cash return materially. Keeping a property valuation checklist that includes a room-by-room scope of work is the most reliable way to avoid cost surprises after closing.
Building a CapEx and vacancy buffer into your model
CapEx reserves, set aside for roofs, HVAC, water heaters, and appliances, should be modeled separately at 5–10% of gross rent. A CapEx reserve belongs in your cash flow model even if no major item fails this year. Apply a vacancy buffer of at least one month per year, roughly 8%, for any property in lease-up or a soft market.
The go/no-go checklist: making your final decision
Once you have real numbers, the decision comes down to whether the deal clears a set of minimum thresholds. If it does not clear all of them at today’s asking price, the analysis has already told you what to do.
Benchmarks that separate good deals from marginal ones
- Monthly rent at or above 0.8–1.0% of total acquisition cost (use this as an initial filter, not a final verdict)
- NOI-based cap rate at or above the local market average
- Cash-on-cash return of 8% or higher after financing and all-in cash invested
- Positive monthly cash flow after all operating expenses and debt service
- DSCR of at least 1.0–1.25 (lenders will require this for DSCR loans anyway)
- Vacancy assumption honest to the local submarket, not a best-case scenario
- Rehab costs confirmed by a physical walkthrough, not an online estimate
Red flags that should stop the deal before you make an offer
- Rent comps that only work in a best-case scenario
- Cap rates significantly below market without a clear value-add thesis
- Negative or near-zero cash flow that relies entirely on future appreciation to pencil out
- Deferred maintenance not reflected in the asking price
- Vacancy rates in the submarket trending upward with new supply coming online
The core principle is simple: the numbers either work at today’s price, or the deal needs a price reduction. No amount of optimism fixes bad inputs.
How the Empowered Investor Network removes most of this legwork
Running this analysis correctly on every deal takes time, local knowledge, and clean data. That problem gets worse when you are buying out of state, which is exactly where most of the best cash flow opportunities are right now. Learning how to evaluate a rental property deal step by step is one thing, having professional infrastructure behind each evaluation is another. That is the problem the Empowered Investor Network was built to solve.
What vetted deal flow actually means for investors
We source properties through a nationwide network of local market specialists who already know the rent comps, the vacancy trends, and the realistic expense ratios in each market.
Getting a free consultation to accelerate your first (or next) deal
Our free one-on-one consultations connect you with a dedicated investment counselor who can review your financial goals, explain the markets currently showing the best cash flow potential, and walk you through how to evaluate specific deals. For investors who are new to rental property underwriting, or who want to scale into multiple markets without becoming a local expert in each one, this removes the trial-and-error phase that costs most investors months or years. Book a free consultation with our team as the logical next step after finishing this checklist.
Put the framework to work
Knowing how to evaluate a rental property deal step by step is the difference between building a durable portfolio and buying headaches at full price. Gather real rent comps and vacancy data, calculate NOI and cap rate, run cash flow and cash-on-cash return after realistic financing, factor in repair costs and CapEx reserves, then apply the go/no-go checklist. If the deal clears every benchmark, it is worth pursuing. If it does not, the numbers told you before you spent a dollar.
The investors who build durable rental portfolios are not smarter than everyone else. They are more disciplined about running the same process on every deal and walking away when the numbers say to. That discipline is a lot easier to maintain when you have vetted deal flow, local market data, and a counselor working through it with you.
If you want help with this rental property deal evaluation process from start to finish, contact our team to see the actual numbers in the markets we work in right now.
Frequently Asked Questions
How do we decide which expense ratio to use when we don’t have line-item figures yet?
Use a 40–45% expense ratio as a reasonable starting benchmark for a professionally managed single-family rental. Replace that percentage with real line-item figures as soon as you have them, because NOI and every downstream metric depend on accurate expenses.
How much contingency should we add to an upfront rehab estimate?
Add a 10–20% contingency on top of any scope estimate, especially for properties built before 1990. That contingency increases your total cash invested and will reduce your cash-on-cash return, so include it in underwriting from the start.
When should we treat the 1% rule as a filter versus a decision to buy?
Treat the 1% rule (0.8%–1.0% rent-to-price in 2026) as an initial filter to prompt a full underwriting, not as a definitive buy signal. If a property falls in that range, run the complete NOI, cash-on-cash, and checklist analysis to confirm whether it meets your benchmarks.
What exactly counts as total cash invested for the cash-on-cash calculation?
Total cash invested includes your down payment plus closing costs, initial repairs, and upfront reserves. Use that full all-in number as the denominator when calculating cash-on-cash return, because it reflects the actual dollars at risk.