
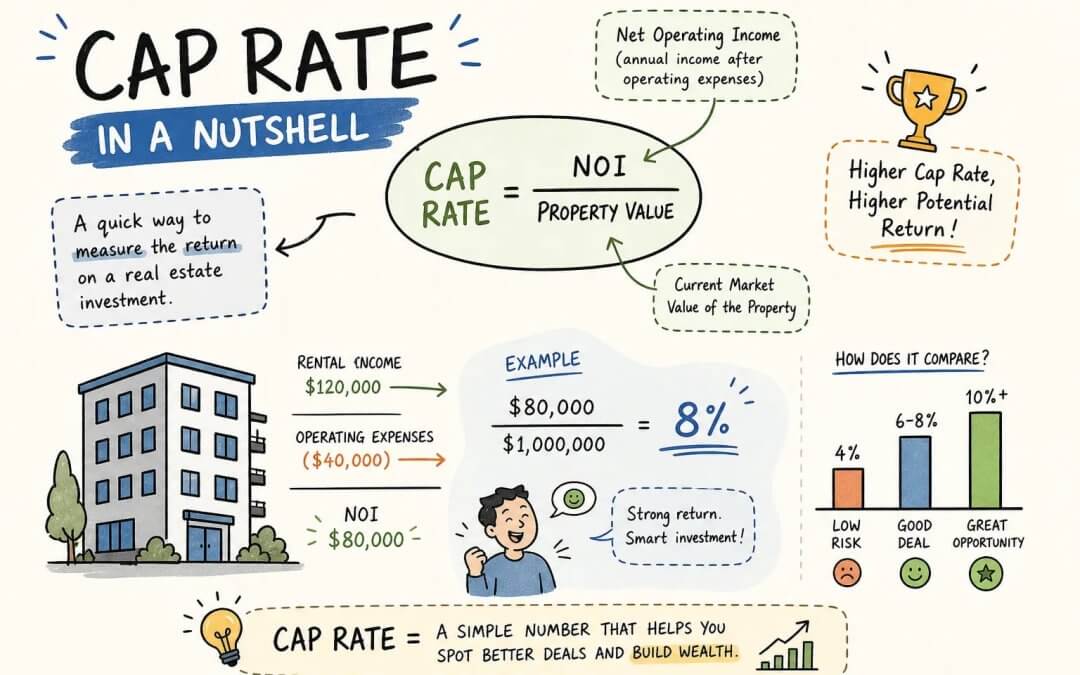
Cap rate explained: cap rate, short for capitalization rate, is the ratio of a property’s net operating income to its purchase price, expressed as a percentage. The formula: divide NOI by purchase price, multiply by 100.
This metric strips out financing, investor-level income taxes, and appreciation, leaving a clean, unleveraged measure of property income. Note that property taxes are an operating expense and do stay in the NOI calculation, only investor-level taxes and debt costs come out. That purity is why cap rate is a common first screen when comparing deals across different markets and property types. It’s not the only number that matters, but nothing else tells you as clearly whether a price makes sense.
Key takeaways
- Cap rate formula: Divide net operating income by purchase price and multiply by 100 to get the property’s unleveraged annual yield.
- NOI accuracy is everything: A cap rate is only as reliable as the NOI behind it; errors in NOI are the most common source of misleading numbers.
- Market context matters: A 7% cap rate in Memphis and a 7% cap rate in Los Angeles represent fundamentally different risk and growth profiles.
- Going-in vs. terminal cap rate: The going-in cap evaluates today’s purchase price; the terminal cap estimates your exit value at the end of your hold period.
- Use three metrics together: Cap rate screens the asset, cash-on-cash evaluates your financing, and IRR measures total performance over time.
- Pro forma is not in-place: Always confirm which NOI basis a quoted cap rate uses before comparing two deals side by side.
What cap rate actually measures
Cap rate answers one question: if you bought this property with all cash, what percentage of your purchase price would you earn back each year from operations? Two investors with completely different financing can evaluate the same asset on exactly the same terms. That apples-to-apples quality is what makes it the standard first screen for deal comparison.
NOI, the engine behind cap rate, equals all rental and ancillary income after vacancy and credit loss, minus recurring operating expenses: property taxes, insurance, maintenance, management fees, and landlord-paid utilities. It does not include mortgage payments, depreciation, investor-level income taxes, or major capital expenditures like a new roof or HVAC replacement. Getting those boundaries right is what makes the resulting cap rate a valid comparison tool rather than a marketing number.
The inverse relationship between cap rate and price is the foundation of real estate valuation. If NOI holds steady and the purchase price rises, the cap rate falls. If the price drops, the cap rate rises. The property didn’t change. The price did. Understanding that dynamic is what lets investors use cap rate not just to describe a deal, but to price one.
Cap rate explained: how to calculate it using real numbers
The formula is straightforward: Cap Rate = (NOI / Purchase Price) x 100. Because purchase price reflects what you actually paid, not an appraised value or replacement cost, it anchors the metric to real transaction data. Simple, but only accurate if the NOI figure is built correctly from the bottom up.
Start with gross potential rent, the income you’d collect if every unit were occupied all year. Subtract a realistic vacancy and credit loss estimate. As a common underwriting rule of thumb, many investors assume 5% to 10% for stabilized residential properties, with the specific figure depending on local market conditions and property class. Add recurring ancillary income such as parking, laundry, pet fees, and storage. That sum is your effective gross income. Then subtract all operating expenses: property taxes, insurance, management fees, maintenance, and landlord-paid utilities. The result is NOI.
Here’s a full example. One important note on management fees: even if you self-manage, include a market-rate management fee in your expense calculation. As a common industry rule of thumb, many underwritings assume 8% to 10% of collected rent for single-family rentals in Midwest and Southern markets. Leaving it out makes the property look better than it actually performs for any owner who isn’t doing the work personally.
What cap rates look like across U.S. markets right now
In 2026, single-family rentals traded nationally in a 4.75% to 6.25% range, with institutional portfolios clustering near 5%. Multifamily assets ranged from 4.75% for Class A coastal properties up to 7.75% for Class B/C suburban markets. Industrial held in the 5% to 7.5% range, retail ran 6% to 8%, and office showed the widest spread: 6.25% at the trophy end up to 10% or higher for challenged suburban assets. These national ranges reflect data from Colliers’ Q3 2026 report and CBRE’s H1 2026 cap-rate survey, which together cover the commercial and residential asset classes listed above.
Location shifts these numbers significantly. A stabilized multifamily asset in Los Angeles might trade at 4.75% to 6%, while a comparable property in Houston trades at 6% to 7.25%. Markets like Dallas-Fort Worth and Atlanta sit in the 5.25% to 6.5% range for single-family rentals, per Colliers Q3 2026. The Empowered Investor Network’s platform focuses on Sun Belt and Midwest markets, including high-yield single-family rental markets such as Memphis, Indianapolis, and Birmingham, where headline yields are stronger than coastal averages.
| Market | Typical 2026 SFR cap rate | Multifamily range |
|---|---|---|
| Los Angeles | 4.75%–5.75% | 4.75%–6.00% |
| Dallas-Fort Worth | 5.25%–6.25% | 5.75%–7.00% |
| Atlanta | 5.25%–6.50% | 5.75%–7.25% |
| Memphis, TN | 7.0%–8.5% | N/A (SFR-focused) |
| Indianapolis, IN | 6.5%–8.0% | N/A (SFR-focused) |
| Birmingham, AL | 7.0%–8.5% | N/A (SFR-focused) |
Sources: Colliers Q3 2026 market report; CBRE H1 2026 cap-rate survey. SFR ranges reflect stabilized, single-family residential transactions in each market.
Lower cap rates in coastal markets reflect higher investor demand, expected appreciation, and compressed perceived risk. Higher cap rates in Sun Belt and Midwest markets reflect stronger cash flow relative to purchase price. The spread isn’t free money, it reflects different growth trajectories and risk profiles. Knowing the difference between those two things is what separates an informed allocation decision from a headline number chase.
Where cap rates go wrong
Cap rate is only as reliable as the NOI behind it. The most common error is using gross rent instead of actual NOI, skipping vacancy, credit loss, taxes, insurance, repairs, and management entirely. That inflated starting point can make a 5.5% deal look like a 7% deal on paper. A second frequent mistake is omitting management fees because the owner self-manages. Any realistic underwriting includes a market-rate fee for that function, since a future buyer or property manager will incur that cost.
Major capital expenditures like roof replacement, HVAC systems, and plumbing are excluded from NOI by convention. That’s standard. But ignoring their timing and cost entirely is not. Always review the capital needs alongside the cap rate, not separately from it.
Pro forma income versus in-place income is where confusion does the most damage. Sellers often quote a “stabilized” cap rate based on projected full occupancy, assumed rent increases, or post-renovation income. That’s a forward estimate, not a current reality. That comparison is meaningless when stacked against a trailing-twelve-month cap from a different property. You’re not evaluating the same thing. Post-sale property tax reassessments are another overlooked distortion. A buyer using the seller’s legacy tax assessment in their NOI may be significantly understating actual future expenses, which overstates the cap rate they think they’re getting.
Going-in cap rate versus terminal cap rate
The going-in cap rate measures the property’s implied unleveraged yield at acquisition, based on Year 1 NOI divided by purchase price. The terminal cap rate estimates the yield a future buyer will require when you sell, used to estimate your exit price in a discounted cash flow model. These two numbers together determine whether a deal creates value over your hold period.
Calculate terminal value this way: divide the forward NOI at exit by the terminal cap rate. If you bought at a 7% going-in cap and your terminal cap assumption is 6.5%, you’re projecting that buyers will pay more for the asset relative to its income at exit than you did at entry. That’s an appreciation assumption embedded in your model. Conservative underwriting typically assumes the terminal cap rate is equal to or modestly above the going-in rate, because assets age, leases roll, and market conditions change over a five to ten year hold period.
The terminal cap rate can have an outsized effect on IRR and equity multiple because sale proceeds are often the largest single cash flow in the analysis. That’s why stress-testing it matters. Run a base case, an optimistic scenario with cap rate compression, and a conservative scenario where the terminal cap is 50 to 100 basis points higher than your going-in rate. The range of outcomes tells you how much of the deal’s return depends on market conditions versus in-place income.
Cap rate, cash-on-cash, and IRR: use all three
Cap rate measures the asset’s unleveraged yield. Cash-on-cash return measures what your actual invested equity earns after debt service. IRR measures total annualized performance over your planned hold, including cash flows, debt paydown, and sale proceeds. These are three different questions, and each requires its own answer.
A property with a 6% cap rate purchased with a 25% down payment could return 8% cash-on-cash if debt is favorably priced, or 4% if it isn’t. Use cap rate to compare properties. Use cash-on-cash to evaluate whether a specific financing structure works for your income needs. Use IRR to judge total performance over your hold period. A large gap between today’s cap rate and a projected IRR should prompt a close look at what assumptions are driving the difference: rent growth, value-add gains, or an aggressive exit cap rate assumption.
Cap rate comes first to screen the asset and validate pricing against comparable transactions. Cash-on-cash follows to evaluate whether the financing produces the income needed. IRR comes last to stress-test the full hold-period strategy. The Empowered Investor Network connects out-of-state investors with local market specialists and investment counselors.
Start using cap rate correctly
The calculation itself is easy: divide NOI by purchase price, multiply by 100, and you have a property’s unleveraged annual yield. Building an accurate NOI is where most beginners go wrong. And interpreting a cap rate without understanding what’s normal for a specific market, property type, and risk profile is where even experienced investors misjudge a deal. This cap rate guide exists to close that gap.
A 7% cap rate in Memphis and a 7% cap rate in Los Angeles are not the same opportunity. The number only becomes useful when it’s accurate, normalized, and benchmarked against the right context. That means verified in-place income instead of pro forma projections, expenses that reflect management fees, realistic vacancy, and a capital plan, and a clear picture of what comparable assets in that specific market actually trade for.
If you’re ready to apply cap rate analysis to real deals in real markets, reach out to the Empowered Investor Network’s investment counselor team for a free consultation. We’ll walk you through the numbers on specific properties, help you benchmark cap rates against current market transactions, and build the full picture, going-in cap rate, cash-on-cash, and IRR, so you can make confident decisions regardless of where in the country you’re investing.
Cap rate explained: frequently asked questions
What is a good cap rate for a rental property?
There’s no single universal answer, but cap rate explained in context is more useful than any benchmark alone. In high-demand coastal markets like Los Angeles, a 4.75% to 5.75% cap rate reflects compressed risk and appreciation expectations. In Midwest and Sun Belt markets like Memphis or Indianapolis, a 7% to 8.5% cap rate is achievable on stabilized single-family rentals. What counts as “good” depends entirely on your strategy, your financing, and what comparable assets in that specific market are actually trading for.
How does cap rate differ from cash-on-cash return?
Cap rate is a financing-free metric, it ignores your mortgage entirely. Cash-on-cash measures what your actual equity earns after debt service. The same property can show a 6.5% cap rate and a 9% cash-on-cash return if the financing is favorable, or a 5% cash-on-cash if it isn’t. Use cap rate to compare properties on equal footing. Use cash-on-cash once you know the financing terms.
What’s the difference between going-in and terminal cap rate?
The going-in cap rate is what you calculate at purchase based on Year 1 NOI. The terminal cap rate is what you assume a future buyer will require when you sell. Conservative underwriting typically sets the terminal cap rate equal to or slightly above the going-in rate to account for property age, lease rollover, and changing market conditions. Stress-testing your terminal cap assumption is one of the most important steps in evaluating any long-hold deal.
Why does cap rate exclude mortgage payments?
Cap rate is designed to measure the property’s income performance independent of how it’s financed. Including mortgage payments would make two identical properties look different just because one buyer put down 20% and another paid cash. By stripping out debt, cap rate gives every investor the same starting point for comparison, which is exactly why it’s the standard first screen before financing enters the conversation.
Frequently Asked Questions
How do we calculate net operating income (NOI) for the cap rate formula?
NOI equals all rental and ancillary income after vacancy and credit loss minus recurring operating expenses. That means start with gross potential rent, subtract a realistic vacancy/credit loss estimate, add ancillary income like parking and laundry, then subtract property taxes, insurance, maintenance, management fees, and landlord-paid utilities to arrive at NOI.
What common underwriting mistakes make a cap rate misleading?
Using gross rent instead of NOI and omitting realistic expenses are the most common errors that misstate cap rate. Other frequent mistakes include excluding a market-rate management fee for owners who self-manage, relying on pro forma or seller-stabilized income instead of in-place income, and ignoring the timing and cost of major capital expenditures.
Should major capital expenditures be included in NOI when calculating cap rate?
No, major capital expenditures like roof or HVAC replacement are excluded from NOI by convention, but their timing and cost must still be reviewed. That means you should analyze capital needs alongside the cap rate rather than treating them as part of NOI so the cap rate remains a valid comparison metric.
How much do market and property type affect what a cap rate means for you?
Market and property type shift cap-rate expectations significantly, so identical cap rates can imply very different risk and growth profiles across locations and asset classes. For example, a 7% cap rate in Memphis reflects stronger cash flow relative to price than a 7% cap rate in Los Angeles, where lower rates reflect higher demand and expected appreciation.