
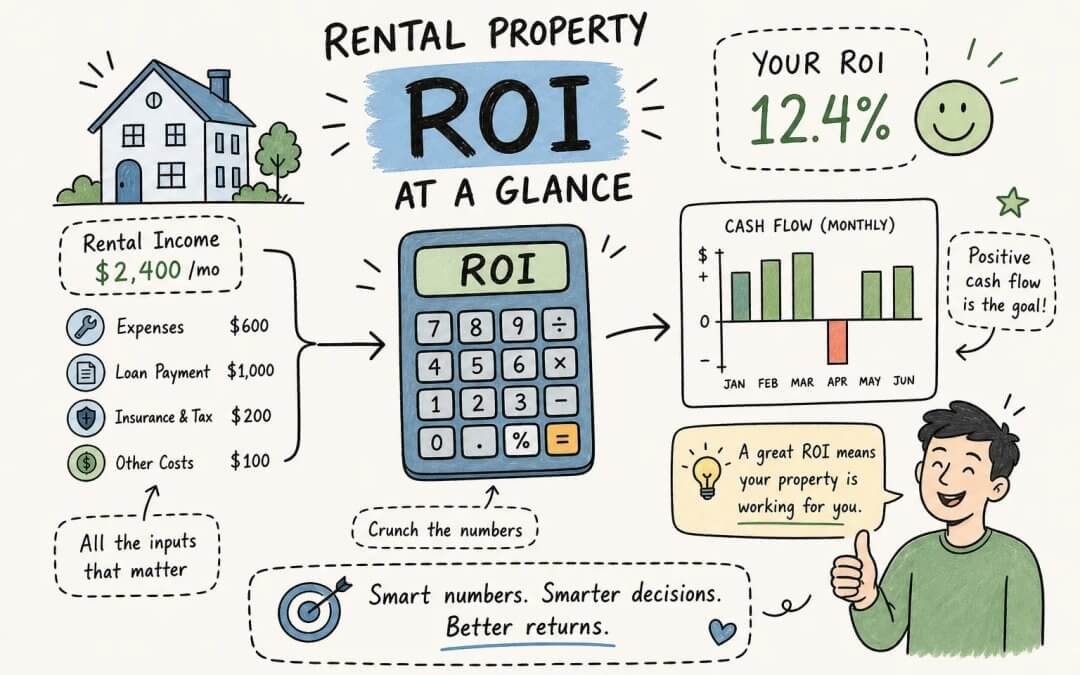
A rental property ROI calculator gives you three numbers that actually matter: cap rate, cash-on-cash return, and IRR. Each one answers a different question about your deal. Cap rate tells you the property’s unleveraged yield. Cash-on-cash tells you how much your actual dollars earn in a given year. IRR tells you the complete investment picture across the entire holding period, including the sale.
Investors leave out vacancy, underestimate maintenance, or conflate cash-on-cash with cap rate and walk away with a number that has no connection to reality. This guide walks through every input, every formula, and what the output should actually look like in 2026.
Key takeaways
- Cap rate is unleveraged: It measures NOI divided by purchase price, with no financing factored in. Use it to compare properties on equal footing.
- Cash-on-cash is leveraged: It measures annual pre-tax cash flow divided by your total cash invested, including down payment, closing costs, and upfront repairs.
- IRR is the full picture: It accounts for cash flow timing, principal paydown, appreciation, and sale proceeds across the entire hold.
- Inputs break the model: Vacancy, management fees, and capital reserves are routinely underestimated, inflating every metric that follows.
- Benchmarks exist: In 2026, target 5.5–7% cap rates in Sun Belt markets, 8–12% cash-on-cash in affordable markets, and 8–12% IRR over a 5–10 year hold, based on Arbor Research national data and 2026 city-level market benchmarks.
- Depreciation improves returns: It shelters real income from tax annually, but the IRS recaptures it when you sell.
What does a rental property ROI calculator actually measure?
The calculator doesn’t produce one number. It produces three, and they measure completely different things. Understanding what each one is actually asking is the prerequisite to using any of them correctly.
Cap rate: the property’s unleveraged yield
Cap rate equals NOI divided by purchase price. It measures the property’s return with zero financing factored in, which is exactly the point. Strip out the mortgage and you can compare any two properties on equal footing, regardless of how each investor chose to finance them. Two buyers purchasing the same house with different loan terms get identical cap rates but very different cash flow numbers.
Cash-on-cash return: what your actual dollars earn
Cash-on-cash equals annual pre-tax cash flow divided by total cash invested. Total cash invested means your down payment plus closing costs plus any upfront repairs, not just the down payment. This is the leveraged return on the money you actually wrote a check for, and it changes dramatically with financing. A 6.3% cap rate can produce a 2.26% cash-on-cash return when interest rates are elevated, as the example below shows.
IRR: the metric most investors skip but shouldn’t
IRR is the discount rate that makes the present value of all cash flows equal to zero across the entire holding period, including the sale proceeds. In plain terms: it’s the one number that combines cash flow timing, principal paydown, appreciation, and your exit into a single annual percentage. A property with thin annual cash flow can still produce a 9% IRR over five years once equity accumulation is factored in. That’s not a rationalization; that’s how the math works.
| Metric | What it measures | Financing included? | Sale proceeds included? |
|---|---|---|---|
| Cap rate | Unleveraged property yield | No | No |
| Cash-on-cash | Annual return on cash invested | Yes | No |
| ROI | Total gain over investment (definition varies; typically cumulative cash flow plus appreciation plus principal paydown, divided by initial cash invested) | Usually | Often |
| IRR | Complete return including timing and exit | Yes (levered) | Yes |
What inputs do you need to get the rental property ROI calculator right?
The formula is the easy part. The inputs are where investors lose money. Every expense category below has a default that most first-timers get wrong.
Purchase price, rent, and vacancy
Start with gross scheduled rent (monthly rent multiplied by 12), then subtract a vacancy allowance before calculating anything else. As a standard underwriting rule of thumb, use 5% in stable, high-demand markets and 8–10% where turnover or seasonality is higher. Skipping the vacancy line is the single most common error first-time investors make, and it inflates every metric that follows because it overstates effective gross income from the first calculation onward.
Operating expenses you can’t afford to underestimate
The full operating expense list includes property taxes, insurance, property management at 8–12% of collected rent, and routine maintenance at 5–8% of gross rent. Budget a separate capital expenditure reserve of 0.5–1% of property value annually for roofs, HVAC systems, and major components. These ranges reflect standard industry underwriting benchmarks. NOI excludes mortgage payments entirely. Mixing in debt service corrupts both the cap rate and any property comparison you’re trying to make.
How financing terms reshape your cash flow
Loan amount, interest rate, and loan term directly determine your monthly debt service, which flows straight into your cash-on-cash return. Conventional 30-year investment mortgages are running approximately 7.3% as of late 2026, with a range of roughly 6.25–7.75% depending on borrower profile, according to Bankrate. Total cash invested must include your down payment, closing costs, initial repairs, and loan fees. Using only the down payment overstates your cash-on-cash return and understates the capital you have at risk.
How do the calculations work on a real deal?
Here’s what the math looks like on two different deal structures, from simple inputs all the way through to IRR. Run each one through your rental cash flow calculator to follow along.
Example 1
That cash-on-cash looks thin. Run the 5-year IRR with 3% annual appreciation and 2% annual rent growth, and the picture changes. The resulting IRR is approximately 9.0%. IRR rewards patience because it counts the equity you build, not just the check you deposit each month.
Example 2
Cash-on-cash return: -3.51%. That looks like a rejection on paper.
The 10-year IRR comes out to approximately 6.2%. Negative cash-on-cash doesn’t automatically mean a bad deal. IRR forces you to think like an investor and account for the wealth built over time, not just the monthly scoreboard. Whether that 6.2% IRR is acceptable depends on your alternatives and your timeline.
What does a good ROI look like in today’s market?
Benchmarks matter because the calculator output is meaningless without context. Here’s what we look for in the markets we work in.
Benchmarks for each metric in 2026
Cap rate: 5.5–7% is a solid target in Sun Belt markets; 7–9% in stable Midwest markets. A cap rate below roughly 4% often indicates an appreciation play rather than an income play, underwrite accordingly. U.S. single-family rental cap rates ran approximately 7.2–7.4% nationally in 2026, according to Arbor Research.
Cash-on-cash: 8–12% is the working target for buy-and-hold investors in affordable markets, based on 2026 city-level market benchmarks. Cleveland posted approximately 10.1% and Indianapolis approximately 8.0% in those benchmarks. Below 6% warrants scrutiny of either the price or the financing structure.
IRR: 8–12% over a 5–10 year hold is realistic for well-underwritten single-family rentals. Above 12% usually means aggressive leverage or strong appreciation assumptions; look hard at both before accepting that number.
What inputs matter most in a rental property ROI calculator?
Vacancy rate, operating expense assumptions, and financing terms carry the most weight. Get any one of them wrong and every output, cap rate, cash-on-cash, IRR, shifts meaningfully. Market selection shapes those inputs directly, which is why we screen properties in our curated network against both local rent data and current underwriting standards before they reach our clients.
Why market and strategy change what “good” means
A coastal property at a 3.5% cap rate may still make sense for a long-term appreciation play. A Midwest rental at 7% cap is typically the better income play in today’s rate environment. The rental yield calculator doesn’t tell you which strategy fits your situation. That depends on your timeline, your tax position, and whether you need cash flow now or wealth accumulation over time.
How do taxes and depreciation quietly boost your real return?
Most investors stop at the pre-tax number. That understates the true return, sometimes significantly.
The annual depreciation advantage
Residential rental buildings depreciate over 27.5 years using straight-line depreciation; land is not depreciable. On a $320,000 allocated building basis, that’s approximately $11,636 per year in non-cash deductions, according to IRS Publication 527. Your after-tax cash-on-cash return is meaningfully better than the pre-tax figure the cap rate calculator or cash-on-cash return calculator displays, and that gap widens the longer you hold.
What the IRS takes back when you sell
Depreciation reduces your adjusted basis, which increases your taxable gain at sale. The portion of gain attributed to prior depreciation is taxed as unrecaptured Section 1250 gain at up to 25% federally. A 1031 exchange defers this liability; it doesn’t eliminate it. Model your after-tax IRR with a qualified tax advisor before making a final decision on any longer hold. The pre-tax number is a starting point, not the finish line.
What should you do after you run your numbers?
Running the rental property ROI calculator is where you start. The next step is making sure the inputs are right, because the formula is only as accurate as what you put into it.
How accurate is a rental property ROI calculator?
The accuracy question is really about inputs. Investors working in markets they don’t live in routinely get vacancy rates, property tax assumptions, and management costs wrong, and those errors compound through every metric. A rental property ROI calculator built on realistic local data will reflect reality; one built on wishful assumptions won’t. That’s the difference between a number you can act on and a number that gets you into trouble.
When your own calculator isn’t enough
Our investment counselors review deals against actual market rent data, local property tax rates, realistic management costs, and current financing terms specific to each market in our network. Getting those inputs right is the difference between a mediocre deal and a strong one, and it’s the part no spreadsheet can do for you.
Getting expert eyes on your deal for free
Ready to pressure-test your numbers before committing? The Empowered Investor Network provides deal analysis tools calibrated to real properties in Sun Belt and Midwest markets where cash flow is most achievable right now. Jason Hartman’s team offers free investment consultations to help you verify your assumptions. A professional deal review is what turns a calculation into a confident decision.
Get the numbers right, then make your move
Cap rate measures the property independent of your financing. Cash-on-cash measures what your actual capital earned this year. IRR measures the full investment across the hold, including appreciation, principal paydown, and your exit. Three numbers, three different questions, all of them necessary to evaluate a rental deal honestly.
A rental property ROI calculator is only as good as what you put into it. Many investors initially underestimate expenses, which is why benchmarking your assumptions against real market data matters so much. Run your numbers, check them against the benchmarks in this guide, and schedule a free consultation with the Empowered Investor Network before you commit. The math is learnable. The markets are there. Go run your numbers.
Frequently Asked Questions
How often should we update the inputs in our rental ROI calculator?
You should update inputs whenever market conditions or property specifics change, because the calculator is only as accurate as its inputs. Regularly revisit vacancy, rent growth, operating expense assumptions, and current financing terms; changes in interest rates or local rents will materially shift cap rate, cash-on-cash, and IRR.
If our cap rate is low, does that automatically mean the deal is bad for us?
No, a low cap rate does not automatically mean the deal is bad; it may indicate an appreciation play rather than an income play. A coastal property at about a 3.5% cap rate can still be sensible for long-term appreciation, but you must underwrite accordingly and decide whether you need cash flow now or wealth accumulation over time.