
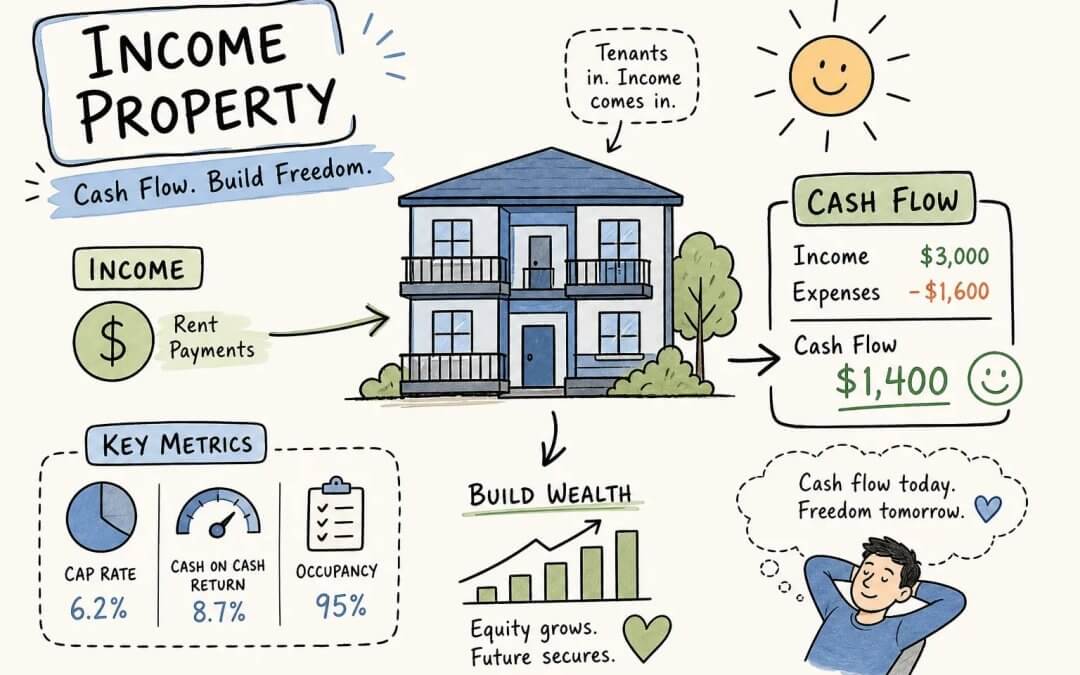
An income property is any real estate you buy primarily to generate rental income rather than to live in. Cash flow is what remains after every expense and mortgage payment clears, and that number tells you whether a deal is worth buying or worth passing on. That’s the core of it. Everything else in this guide builds on those two ideas.
What follows is a practical framework: a clear definition, the cash flow formula, and the three metrics every investor should run before making an offer. At the Empowered Investor Network, this is precisely where we start with every client who knows they want rental income but needs a structured approach before pulling the trigger. The math here isn’t theory. It’s the same calculation experienced investors run on every deal.
Key takeaways
- Cash flow is the goal: Positive rent does not automatically mean positive cash flow. Every real cost must be subtracted, not just the mortgage payment.
- Cap rate measures the property: It evaluates the asset independent of how you finance it, making it the right tool for comparing deals.
- Cash-on-cash measures your money: This metric reflects your actual financing situation and tells you what your down payment is earning.
- Midwest markets lead on yield: Cities like Cleveland, Indianapolis, and Cincinnati consistently produce gross rental yields above coastal metro averages in 2026, according to Ark7’s 2026 analysis and Baselane’s 2026 market data.
- Expense modeling is non-negotiable: Budget 35–50% of gross rent for operating expenses before debt service, and never skip the capital-expenditure reserve.
- Start with a free consultation: The Empowered Investor Network offers free consultations for investors ready to move from understanding the numbers to evaluating real deals.
What exactly is an income property?
The simple definition (and why “investment property” isn’t quite the same thing)
An income property is real estate acquired primarily to generate recurring rent or lease payments, not for personal use. The income is the point; appreciation is a bonus if it arrives. This distinguishes income-generating real estate from a fix-and-flip, where the plan is to sell quickly for a profit, and from a vacation home used personally, even if you rent it out occasionally.
The term “investment property” is sometimes used interchangeably, but it’s broader. A vacant lot or a property bought purely for future value can be an investment property. An income property has a specific job: produce cash every month. That recurring revenue is what defines it, in both common practice and lending underwriting.
Types of income properties beginners typically start with
Single-family rentals and small multifamily properties (2–4 units) are where most first-time investors begin. Single-family homes are easier to finance with conventional loans, attract a wide tenant pool, and are simpler to manage. Small multifamily properties offer multiple income streams under one roof, which provides a buffer against vacancy. We work primarily with single-family and small multifamily properties in high-cash-flow U.S. markets, and that focus is deliberate.
Single-family rentals average approximately 7.2% cap rates nationally in 2026, according to Arbor’s Single-Family Rental Investment Trends Report, compared to roughly 5.6% for institutional multifamily. That gap matters when you’re building a portfolio from the ground up and every dollar of yield counts.
Cash flow vs. appreciation: which should a beginner prioritize?
Prioritize cash flow. Appreciation is real, but it’s unpredictable, and you can’t pay a repair bill with projected future value. A property that loses money every month is called an “alligator” for a reason: it eats cash steadily until something forces your hand. Building every model around income first means underwriting the deal so that it generates positive cash flow at current rents, with realistic expenses, before you give any weight to future price gains. Treat appreciation as upside, not as a plan.
How does a rental property actually generate cash flow?
The cash flow equation, step by step
Start with gross scheduled rent. Subtract a vacancy allowance to get effective gross income. Subtract operating expenses from that to get net operating income (NOI). Then subtract your mortgage payment to arrive at annual cash flow. That’s the full sequence, and each step matters.
One critical point: the mortgage payment is not part of NOI. NOI is calculated before debt service. This matters because cap rate uses NOI divided by purchase price, so folding the mortgage into that calculation produces a meaningless number. Keep them separate from the start.
Why positive rent doesn’t automatically mean positive cash flow
Cash flow is what remains after all real costs clear, not just after the principal and interest payment.
Beginners get burned here because they run rent-minus-mortgage and stop. The full picture requires every line item on the expense side. Run the complete numbers before you get emotionally attached to any property.
What vacancy does to your numbers
According to MPA Magazine’s Q3 2026 rental market data, the broader U.S. rental vacancy rate sits around 7.6%. Build a vacancy line into every model from day one, and don’t let an optimistic seller projection talk you out of it.
What metrics should you run before making an offer?
Cap rate: the unleveraged yield test for any income property
Cap rate equals NOI divided by purchase price, expressed as a percentage. It measures how the property performs regardless of financing. Two investors can buy the same property with different down payments and different loan rates; they’ll receive different cash-on-cash returns but always share the same cap rate. That’s what makes it the right tool for comparing properties and evaluating market pricing.
Single-family rentals average approximately 7.2% nationally, according to Arbor’s Single-Family Rental Investment Trends Report for 2026. Midwest markets push that figure higher: gross rental yields in Cleveland average around 9.8%, Indianapolis around 7.1%, and Cincinnati around 7.5%, according to Ark7’s 2026 analysis of top rental markets and Baselane’s 2026 market data. These are pre-expense gross yields, not NOI-based cap rates, so run your full underwriting before drawing direct comparisons. When a cap rate falls below 5% in a market without an exceptional appreciation track record, the deal deserves extra scrutiny before you proceed.
Cash-on-cash return: what your down payment actually earns
Cash-on-cash return equals annual pre-tax cash flow divided by total cash invested. Unlike cap rate, it reflects your financing situation directly. The same property looks very different to a cash buyer versus someone borrowing at today’s rates, and cash-on-cash captures that difference.
Monthly cash flow: the number most beginners fixate on (and why that’s fine)
A thin cash flow deal isn’t automatically a pass if the market fundamentals, tenant quality, and long-term equity build a compelling case, but you need that number in front of you before the conversation goes any further.
| Metric | Result |
|---|---|
| Cap rate | 6.57% |
The numbers change meaningfully in lower-price markets. Market selection matters as much as the formula.
What do operating expenses actually cost you?
The standard expense categories you must model for any rental investment
Every serious underwriting model includes these line items:
- Property management: 8–10% of collected rent
- Maintenance and repairs: 5–10% of gross rent (use the higher end for older properties)
- Capital-expenditure reserve: 5–10% of gross rent for roofs, HVAC systems, and appliances
- Property tax and landlord insurance: Use actual quotes, not national percentage estimates
- Vacancy and credit loss: 5–8% of gross scheduled rent
These aren’t optional columns in a spreadsheet. They’re the difference between a model and a wish.
The 50% rule: a quick screening shortcut and its limits
The 50% rule treats roughly half of gross rent as operating expenses before debt service. It’s a fast way to filter out obvious losers and sanity-check a pro forma that looks suspiciously lean. Use it to eliminate deals quickly, not to finalize underwriting. When a property barely passes at 50%, dig deeper before you get to an offer.
One common modeling error: double-counting maintenance and capital reserves. Routine repairs belong in the maintenance line. Large periodic replacements, a new roof, a full HVAC replacement, belong in a separate CapEx reserve. They serve different purposes and shouldn’t be collapsed into one number.
The most common expense mistakes beginners make
Leaving property management out of the model because the buyer plans to self-manage is the first and most expensive mistake. Self-managing has real costs in time, attention, and risk. Excluding it from the model doesn’t eliminate those costs; it just hides them.
Skipping the CapEx reserve on a recently renovated property is the second. Everything wears out eventually, and a new kitchen doesn’t extend the life of a 20-year-old roof.
Using the seller’s current property tax bill rather than the post-sale reassessed value is the third. In many counties, the sale triggers a reassessment that can push taxes substantially higher than what the seller has been paying. Run your numbers on the reassessed figure, not the current one.
How do you find your first income property?
Which U.S. markets produce the best cash flow right now?
Many investors in high-priced coastal metros struggle to find traditional positive-cash-flow deals at typical leverage. The math doesn’t work at those price levels. Sun Belt and Midwest markets consistently produce better yields: Indianapolis, Cincinnati, and Cleveland appear repeatedly in 2026 analyses of the top cash-flow markets for single-family and buy-to-let rentals. These aren’t obscure bets; they’re established rental markets with strong tenant demand and regulatory environments that have historically been more favorable to landlords than many coastal jurisdictions.
Multi-state investing is straightforward with the right structure. With local market specialists in vetted markets and proper due diligence, buying a rental income property in Indianapolis while living in Los Angeles is a structured process. It’s not a gamble. It’s a geographic arbitrage that many of the best-performing rental portfolios are built on.
How to get reliable rent comps before you commit
The hierarchy for rent data matters. Recent leased MLS comps from the past 90 days are the most reliable starting point; they reflect what tenants actually signed, not what landlords hoped to get. Zillow asking rents show you the market ceiling, not the achieved rent. Local property-manager feedback is often the single most accurate data point for small single-family and 2–4-unit properties, particularly for markets you don’t know firsthand.
Rentometer and Mashvisor are useful for a broad statistical check and percentile positioning, but neither should stand alone in your underwriting. Build a simple comp grid: beds, baths, square footage, lease date, actual signed lease rent (not asking rent), condition, and amenities. The discipline of that grid forces you to compare cash-flow properties honestly rather than cherry-pick the highest rents.
Why most beginners get further faster with a network behind them
The math in this guide takes an afternoon to learn. The harder work is knowing which markets to target, which neighborhoods to avoid, and which numbers to trust. That knowledge takes years to build independently, and most investors don’t have years to burn before their first acquisition.
That’s the problem the Empowered Investor Network was built to solve. We connect investors with local market specialists in vetted markets and pair them with dedicated investment counselors who guide clients through multi-state property acquisitions. If you’ve absorbed this guide and you’re ready to evaluate real deals, a free consultation is the natural next step. No commitment, just clarity on where your capital fits and what a realistic first income property looks like for your situation.
The honest bottom line
Income property investing rewards honesty over optimism. The frameworks are learnable, the mistakes are consistent, and the math is not complicated. What trips beginners up is not the formula; it’s overstating rent, underestimating expenses, and ignoring what financing costs do to leveraged returns in a high-rate environment.
Run the numbers before you fall in love with a property. Know your cap rate, your cash-on-cash return, and your monthly cash flow before you make an offer. Those three metrics won’t guarantee a good deal, but they will protect you from a bad one. The gap between understanding a framework and applying it to a real property in a real market is exactly where guidance pays off.
The investors who build real portfolios aren’t smarter than you. They started, they ran the numbers honestly, and they didn’t go it alone. Connect with the Empowered Investor Network for a free consultation when you’re ready to move from understanding the math to finding your first rental property.
Frequently Asked Questions
How much should we set aside for a capital-expenditure reserve each month or year?
Budget 5–10% of gross rent for a capital-expenditure reserve. This covers periodic large replacements like roofs, HVAC systems, and appliances and should be modeled separately from routine maintenance so you don’t double-count expenses.
Can we simply self-manage a property to avoid property-management fees in our model?
You should not remove property-management costs from your underwriting just because you plan to self-manage. Self-managing has real costs in time, attention, and risk, and excluding that line item only hides those costs; budget 8–10% of collected rent for professional property management as the standard modeling approach.
Do we need to assume higher property taxes after purchase?
Yes, run your numbers on a reassessed tax figure rather than the seller’s current bill. In many counties the sale triggers a reassessment that can push taxes substantially higher than the seller has been paying, so use the post-sale reassessed value in your underwriting.
Are Midwest markets genuinely better for cash flow than high-priced coastal metros?
Yes, Midwest markets like Cleveland, Indianapolis, and Cincinnati consistently produce higher gross rental yields than many coastal metros, making it easier to find positive-cash-flow deals. Many investors in high-priced coastal metros struggle to find traditional positive-cash-flow deals at typical leverage, so geographic arbitrage into established Midwest rental markets is a common strategy.