
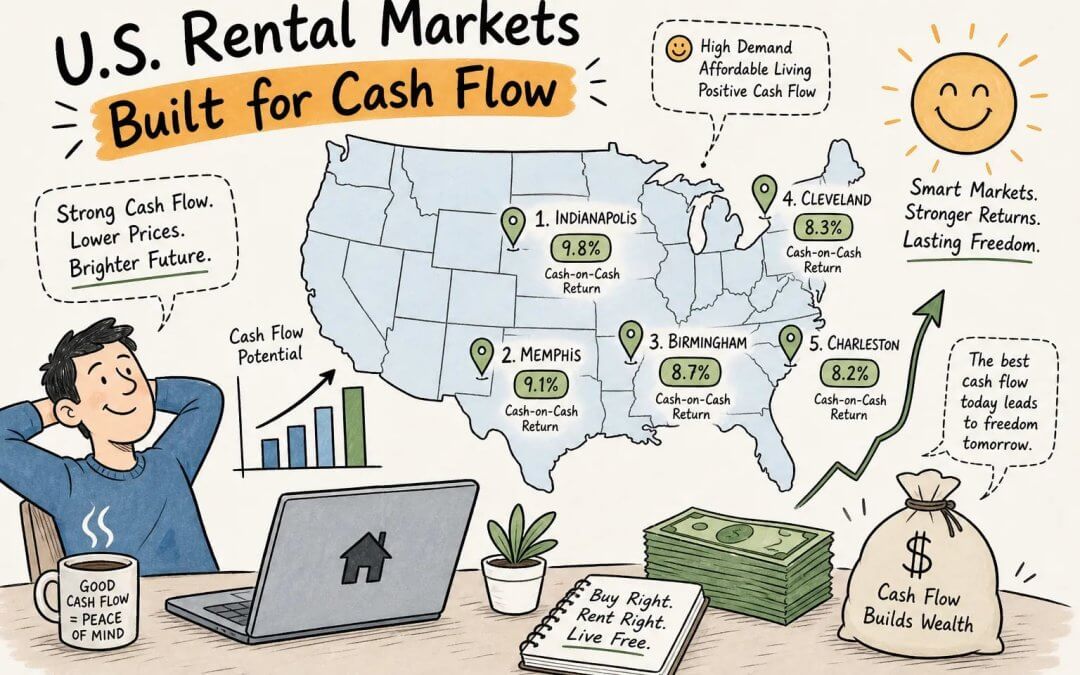
Most investors spend weeks researching “the best markets” and then make their decision based on a podcast recommendation or a Reddit thread. The question they forget to ask is the only one that actually matters: what are the best markets to buy rental property right now, and what does the cash flow look like after all costs? In 2026, that question has a genuinely complicated answer, because the U.S. rental market is running two separate stories at once. The Midwest is delivering net yields that would have looked exceptional five years ago. The Sun Belt is dealing with supply overhang in certain metros while still flashing strong long-term demand signals underneath the noise.
This guide cuts through both stories with real data. It ranks markets across four core metrics, covers specific numbers on yields, vacancy rates, rent growth, and regulatory risk, and ends with a clear process for shortlisting the markets that actually fit your strategy. The market intelligence applied here follows the same rigorous, deal-level analysis that the Empowered Investor Network, built by Jason Hartman over decades of multi-state investing, applies when sourcing deals in top rental markets 2026 coastal investors never think to consider.
The four metrics that separate great rental markets from average ones
Cash-on-cash return and rent-to-price ratio: the two numbers that matter most
Cash-on-cash return is your real return on invested capital after financing costs, not the gross yield number that gets thrown around in market rankings. A property with a 10% gross yield and a 7% mortgage rate is not the same investment as a property with a 7% gross yield and a 7% mortgage rate. The rent-to-price ratio is the fastest first-pass filter for whether a market can generate positive cash flow at all. Divide the monthly rent by the purchase price: a $150,000 home renting for $1,400 a month carries a 0.93% ratio. A $450,000 home renting for $2,800 carries a 0.62% ratio. Both produce the same gross rent, but the first can realistically cash flow after debt service and the second almost certainly cannot.
Population growth and job market signals as demand predictors
Job growth precedes population inflow by roughly 18 to 24 months, and population inflow precedes rent demand by another 12 to 18 months. What that means practically is that trailing 12-month employment data is the leading indicator most investors skip entirely. CoStar metro-level tracking found that areas with higher annual job growth recorded higher rent growth in 94 of 99 measured quarters. That structural relationship tells you that today’s job market trends show up in your rental income roughly 12 to 24 months from now, which means investors who read employment data correctly are underwriting future rent before it shows up in any listing.
Landlord-friendliness: the silent variable in your underwriting
Eviction speed, property tax rates, and short-term rental (STR) restrictions all affect net returns without showing up anywhere in a headline cap rate. A market with a 9% gross yield in a state with a 6-month eviction timeline and aggressive local STR enforcement can underperform a market with a 7% yield and a 3-week eviction process. Treat regulatory environment as a risk-adjustment layer built into every deal you analyze, not as a qualitative preference you consider after the fact.
What Are the Best Markets to Buy Rental Property Right Now: Top Cash-Flow Picks
Toledo and Cleveland: the net yield leaders in 2026
Toledo posted a 7.5% net yield and Cleveland a 7.2% net yield in 2026 ATTOM market data, which places them at the top of any credible list of cash-flowing rental markets in the country right now. Both cities benefit from the same structural advantages: low acquisition prices, stable blue-collar rental demand, and limited new construction that keeps vacancy from drifting upward. Price-to-rent ratios in both markets sit around 13 to 14, which means the rent you collect is a meaningful percentage of the price you pay. Ohio also carries relatively balanced landlord-tenant law compared to coastal markets, which takes significant regulatory risk off the table.
Detroit and Memphis: high gross yields with important tradeoffs
Detroit reported gross rental yields as high as 20.7% in some metro-level datasets, and Memphis came in around 10.2%. Those numbers get attention, and they should, but gross yield and net yield diverge sharply in both markets. Property management costs, insurance, taxes, and maintenance eat into returns more aggressively here than in more stabilized Midwest markets. Detroit and Memphis reward investors who do thorough due diligence and partner with experienced local operators. They are not entry-level markets, but for experienced buyers who understand the cost structure, the upside is real.
What a real deal looks like in these markets
Consider a straightforward example: a $130,000 purchase price, $1,200 per month in rent, 20% down, and standard financing assumptions. That rent-to-price ratio sits at 0.92%, above the 0.8% threshold where positive cash flow becomes achievable even after accounting for vacancy, property management, taxes, and maintenance. Run the numbers with a 7% vacancy assumption and an 8% property management fee, and a deal like this can still generate meaningful monthly cash flow. That is the basic math that makes the Midwest worth a serious look.
Sun Belt markets with strong demand fundamentals
Atlanta and Charleston: job growth as the leading demand indicator
Atlanta is holding up well despite the broader Sun Belt supply story. Steady job growth and population gains are keeping apartment demand resilient even as new deliveries enter the market, and vacancy sits at around 5.86% in 2026, well below the oversupplied metros to the south. Charleston stands out even more sharply: 3.7% annual job growth puts it among the strongest relative gainers of any tracked market this year. In a smaller market, that level of job growth has an outsized effect on vacancy tightening, because the pool of available units is smaller relative to the number of new households forming.
Dallas-Fort Worth and Reno: population inflow and absorption dynamics
Dallas-Fort Worth’s employment base sits above 4.2 million with year-over-year job growth of roughly 1.3%, underpinned by rapid population inflow and a business-friendly regulatory environment that continues to attract corporate relocations. The multifamily vacancy picture in DFW is looser than some markets, which means buyers who can underwrite a slower lease-up period are shopping in a market where long-term demand fundamentals are intact. Reno added over 2,100 jobs in just the first four months of 2026, with Class A rental demand benefiting from continued office-sector expansion. Both metros are positioned for sustained rental absorption even as some Sun Belt cities manage through supply overhang.
Where rent growth is actually happening in 2026
Virginia Beach is posting 7.2% year-over-year rent growth and carries the highest occupancy rate among the 50 largest U.S. markets. Boise is running at 9.1% year-over-year rent growth. These are not speculative appreciation plays built on thin fundamentals. They are markets where demand is genuinely outpacing supply, and the rent growth shows up in the income statement, not just in a projected future value. Investors hunting for buy-and-hold markets with real rent momentum have data worth following here.
What vacancy rates and regulations actually tell you about risk
High-vacancy Sun Belt markets and what they mean for your cash flow
The vacancy data in several Sun Belt metros is stark. San Antonio is sitting at 16.0% multifamily vacancy. Houston is at 12.9%. Jacksonville comes in at 11.7%, and Phoenix at 11.6%. The national average is 7.3%. Buying into these markets right now means underwriting a slower lease-up, more concessions to attract tenants, and compressed near-term returns that a spreadsheet built on stabilized assumptions will not capture. Contrast that with Boston at 3.2% vacancy and Riverside at 3.3%: markets where landlords hold pricing power and concessions are essentially nonexistent.
Landlord-friendly versus tenant-protective regulatory environments
Texas markets, including Dallas, San Antonio, and Houston, generally offer faster eviction timelines and carry no statewide rent control risk, which matters when you are underwriting a long hold. Note that Texas’s higher effective property tax rates compress net yields even in that otherwise landlord-friendly legal environment, and that compression needs to appear in your deal math before you commit. Florida markets are landlord-friendlier than coastal states but face local short-term rental restrictions in a growing number of cities.
Ohio markets sit in a balanced regulatory zone that does not introduce the tail risks coastal states can. California, even in the tight Riverside market, carries significant tenant-protection risk, including aggressive rent control ordinances and extended eviction timelines, that should be built into your underwriting assumptions, not added as a footnote. The regulatory layer is not a qualitative preference; it is a line item.
What Are the Best Markets to Buy Rental Property Right Now: How to Shortlist 3 That Match Your Strategy
Choosing your thesis first: cash flow versus appreciation
The most common analytical mistake investors make is mixing strategies mid-analysis. Midwest and Rust Belt markets, particularly Toledo, Cleveland, and Memphis, are built for cash-flow investors who want strong monthly returns on lower-priced assets. The numbers support that thesis today. Sun Belt growth markets like Atlanta, Dallas, and Charleston lean toward buy-and-hold investors who accept thinner initial yields in exchange for rent growth and equity appreciation over a 7 to 10 year hold. Mixing those two frameworks in the same analysis produces paralysis. Pick your thesis before you pick your market.
Running the numbers before you commit
Start with the rent-to-price ratio as a quick filter. Target 0.8% or higher for cash flow, and consider 1.0% or above as strong. Estimate net operating income by applying the market-specific vacancy rate directly, not a generic national average. Subtract debt service based on your actual financing terms, and sanity-check cash-on-cash return against what you need to make the investment worth your time and capital. That four-step process tells you more about whether a market works for you than any ranking list ever will.
Getting eyes on the ground in markets you don’t live in
Executing in a market you don’t know requires vetted local operators, not just good data. Most out-of-state investors stall at exactly this point: they have the numbers, they have a market thesis, and then they have no idea who to trust on the ground. The Empowered Investor Network, built by Jason Hartman over decades of multi-state investing, specifically connects investors with local market specialists in high-performing markets across the country. That network addresses the most common friction point in remote real estate investing: finding operators with real accountability, not just a business card and a website. If that process points you toward markets you don’t currently operate in, the network exists to bridge the gap, direct contact is available through the Empowered Investor Network.
The markets are different; the framework is the same
So what are the best markets to buy rental property right now? The honest answer is that the top markets depend entirely on your strategy. If cash-on-cash return is the priority, Toledo, Cleveland, and Memphis have the data behind them. If long-term demand fundamentals matter more, Atlanta, Charleston, and Dallas-Fort Worth are positioned well going into the next several years. Virginia Beach and Boise offer strong rent-growth signals for investors who want momentum on both sides of the income statement, making them worth a close look as best places to invest in real estate for yield-plus-growth strategies.
Real estate markets shift. What does not shift is the framework for evaluating them: run the rent-to-price ratio first, layer in vacancy and regulatory risk, validate with local job growth data, and confirm with people who are actually operating in the market. Investors who run that process and move with accountable local partners find better deals faster. Consistently. That is not luck, and it starts with knowing which rental yield cities to shortlist in the first place. If you are still asking what are the best markets to buy rental property right now, that four-step framework is where the answer begins.